Temp-Troller Selection Procedure
Temp-Troller Electra-Cool
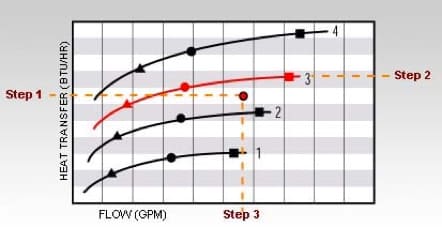
Selection Procedure
Plotted pressure drop (PSID) values based on viscosity of 50 SSU. If viscosity is not 50 SSU, multiply PSID value by tabulated multiplier to obtain estimate of actual PSID:
Viscosity |
PSID Multiplier |
|---|---|
| 50 SSU | 1 |
| 100 SSU | 1.75 |
| 150 SSU | 2.3 |
| 200 SSU | 2.75 |
| 250 SSU | 3.2 |
Step 1
System flow rate (GPM) of hot liquid
Step 2
Heat transfer requirement = input energy lost to heat 1 HP = 2545 BTU/HR
Performance curves based on Inlet Temperature Difference (ITD) of 50°F ITD = (Inlet temperature of hot liquid) - (Ambient temperature of air)
If ITD is not 50°F: Heat transfer requirement = Input energy lost to heat x 50°F/ITD
Step 3
Select curve for heat exchanger model at or above heat transfer requirement
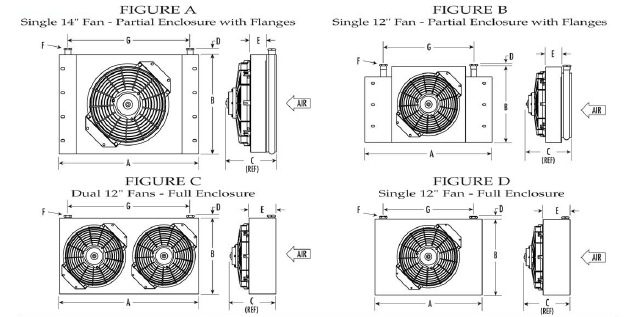
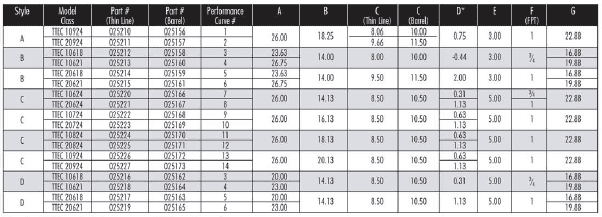
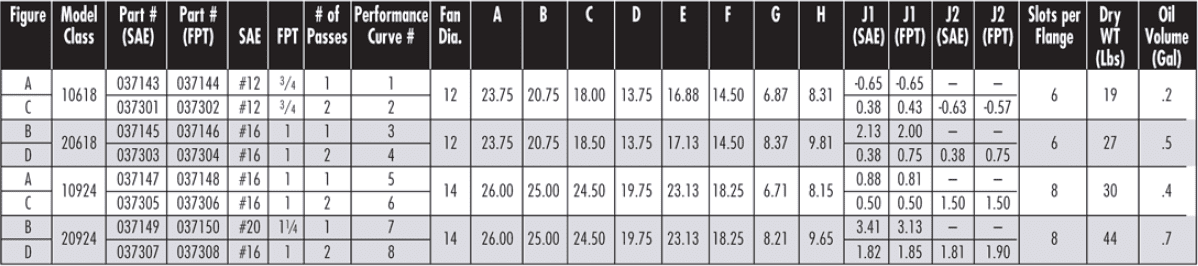
Dimensional Data
Figure letter refers to the diagrams above. Dimensions are in inches. Performance Curve # refers to the Performance Charts below.
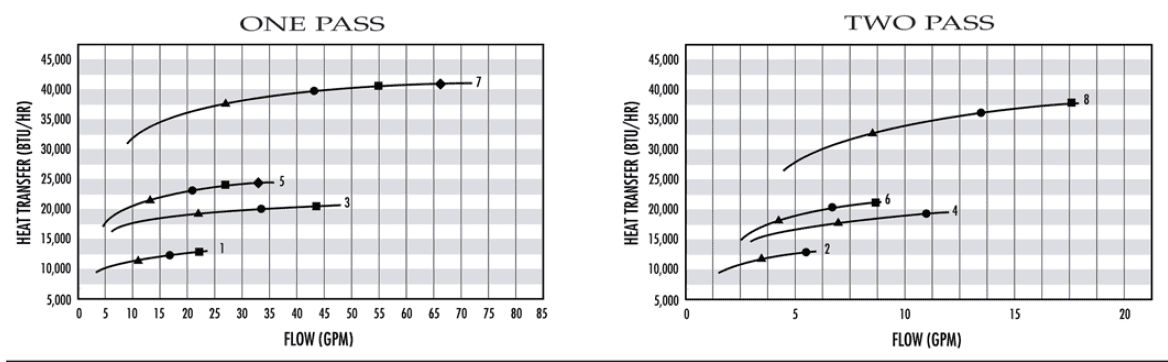
Performance Charts
Heat transfer performance based upon 50°F ITD with barrel style motor. See Selection Procedure for sizing heat exchanger.
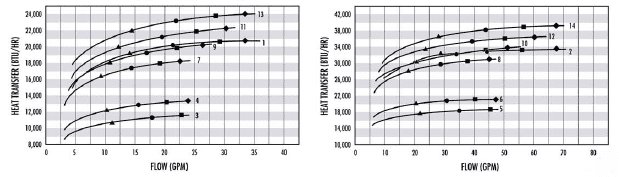
Pressure Drops Indicated:
-
 5 PSID
-
 10 PSID
-
 15 PSID
-
 20 PSID
Temp-Troller AC-Cool
Selection Procedure
Plotted pressure drop (PSID) values based on viscosity of 50 SSU. If viscosity is not 50 SSU, multiply PSID value by tabulated multiplier to obtain estimate of actual PSID:
Viscosity |
PSID Multiplier |
|---|---|
| 50 SSU | 1 |
| 100 SSU | 1.75 |
| 150 SSU | 2.3 |
| 200 SSU | 2.75 |
| 250 SSU | 3.2 |
Step 1
System flow rate (GPM) of hot liquid
Step 2
Heat transfer requirement = input energy lost to heat 1 HP = 2545 BTU/HR
Performance curves based on Inlet Temperature Difference (ITD) of 50°F ITD = (Inlet temperature of hot liquid) - (Ambient temperature of air)
If ITD is not 50°F: Heat transfer requirement = Input energy lost to heat x 50°F/ITD
Step 3
Select curve for heat exchanger model at or above heat transfer requirement
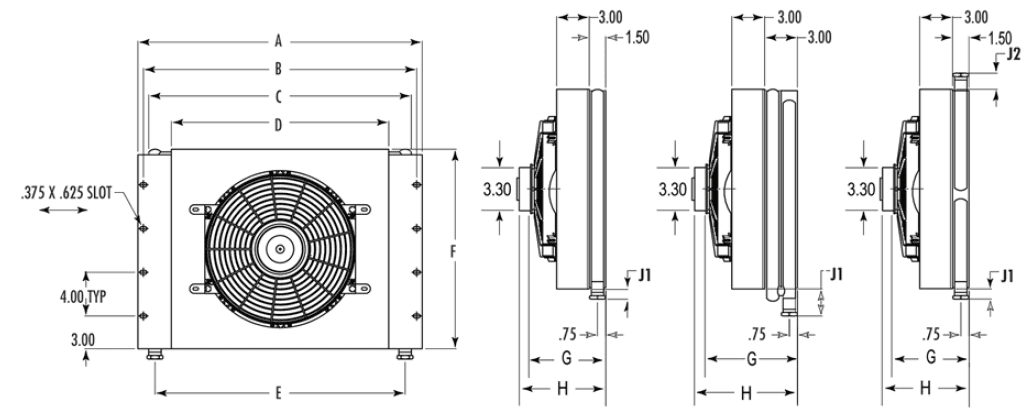
Dimensional Data
Figure letter refers to the diagrams above. Dimensions are in inches. Performance Curve # refers to the Performance Charts below.
Performance Charts
Heat transfer performance based upon 50°F ITD with barrel style motor. See Selection Procedure for sizing heat exchanger.
Pressure Drops Indicated:
-
5 PSID
-
10 PSID
-
15 PSID
-
20 PSID
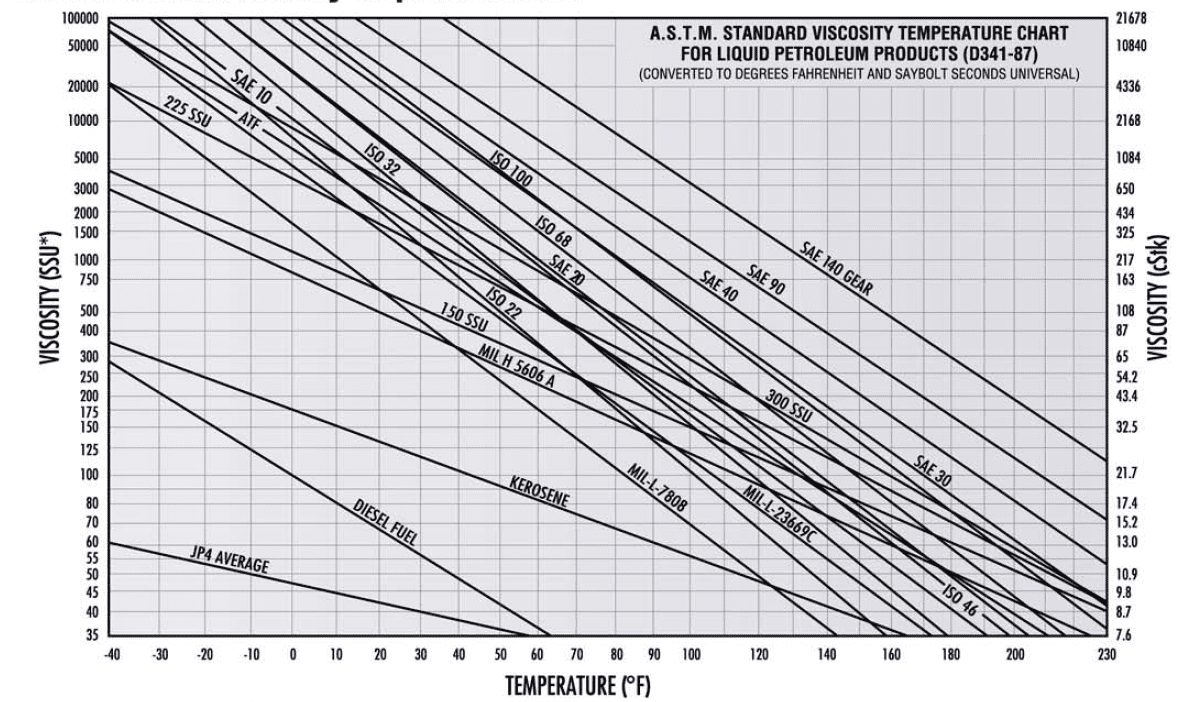
APPENDIX
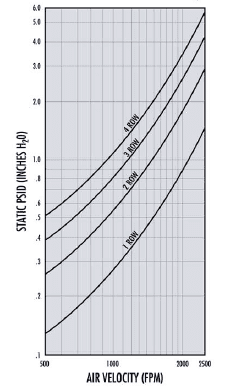
A.S.T.M. Standard Viscosity Temperature Chart & Fin CoolⓇ Air Static Pressure Drop - 12 FPI
*For viscosities less than 35 SSU use 35 SSU in sizing the heat exchanger.
Hose Diameter vs Fluid Flow
Hose I.D. (inches) |
Flow - Return Line (GPM) |
Flow - Pressure Line (GPM) |
|---|---|---|
| 1/2 | 2 - 3 | 5 - 8 |
| 3/4 | 4 - 6 | 10 - 20 |
| 1 | 8 - 12 | 10 - 35 |
| 1 1/4 | 12 - 20 | 30 - 55 |
| 1 1/2 | 20 - 30 | 45 - 90 |
| 2 | 35 - 60 | 75 - 150 |
Air Velocity & Air Flow
To determine air velocity in Feet/Minute (FPM) through the heat exchanger from known air flow in Feet3/Minute (CPM):
Air Velocity (FPM) = Air Flow (CPM) / Heat Exchanger Finned/Core Area (Feet2)
Altitude Adjustment
Performance Curves are based on sea level conditions. Derate heat transfer performance for tube and fin heat exchangers by 2.5% for every 1000-foot gain in altitude.
FLOW
GPM = Displacement (Inches3/Rev) x RPM / 231
ENERGY
HP = Flow (GPM) x Pressure (PSI) / 1714
Why we do this


Hayden’s profits help the Ventura Global Health Project
bring direct clinical care to the world’s poor.

 Learn More